Examining How Micro-Event Data Analytics Drive Shifts in In-Play Markets for Rugby, Baseball, and Hockey Competitions
Rosa Fischer · Aug 21, 2026
Examining How Micro-Event Data Analytics Drive Shifts in In-Play Markets for Rugby, Baseball, and Hockey Competitions
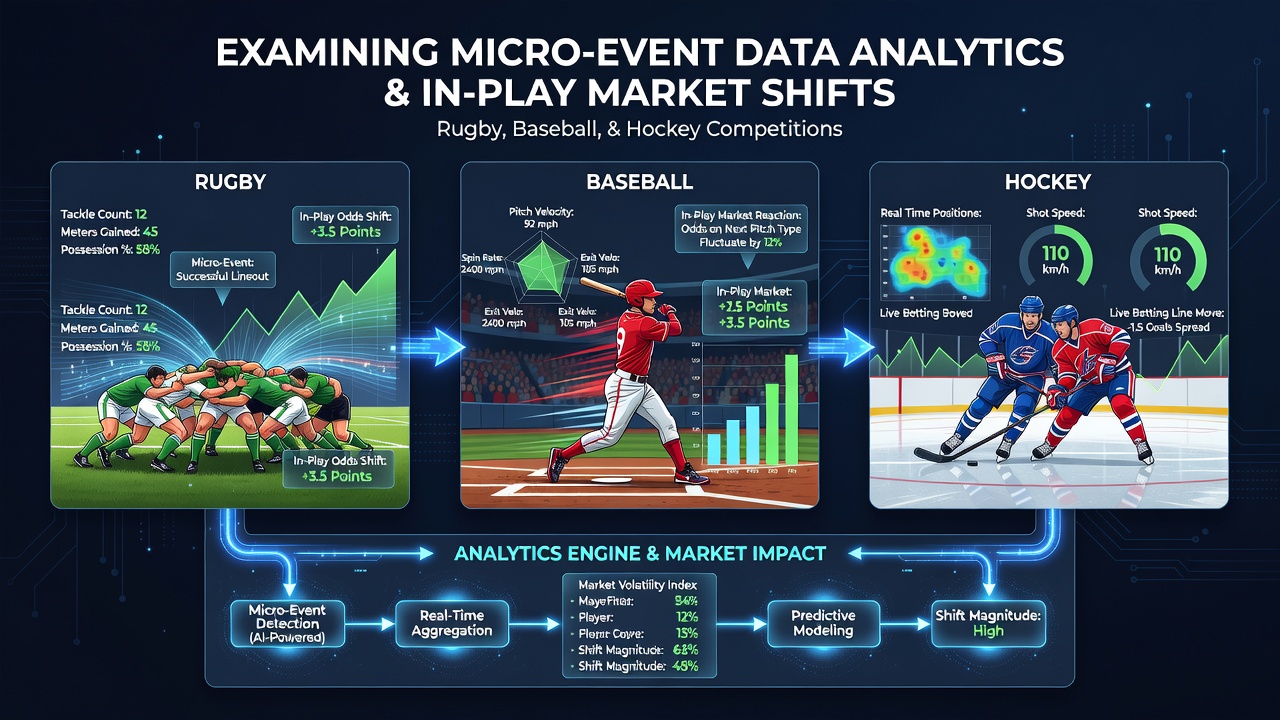
Analysts track micro-event data points such as player acceleration bursts, ball trajectory adjustments, and positional shifts in real time, and these elements feed directly into in-play market recalibrations across rugby, baseball, and hockey. Observers note that data streams from wearable sensors and optical tracking systems update odds within seconds while matches unfold, creating rapid adjustments that reflect granular performance changes rather than broad game outcomes alone.
Rugby Market Dynamics
Researchers at several sports science institutes have documented how scrum stability metrics and breakdown speed indicators alter try-scoring probabilities in rugby union and league formats, and these variables trigger immediate revisions to handicap lines and total points markets. Take one analyst who monitored a 2025 Super Rugby match where repeated tackle completion rates above 92 percent correlated with sustained possession advantages, prompting bookmakers to shift live over-under thresholds by multiple increments within a single quarter. Data shows that micro-analytics on ruck speed and line-break attempts further influence player performance props, allowing markets to respond to individual contributions that accumulate over short time windows.
Baseball In-Play Adjustments
Baseball presents a different data profile because pitch-by-pitch tracking captures spin rates, release points, and exit velocities, and these measurements drive continuous updates to strikeout, walk, and home-run propositions during innings. Figures from Major League Baseball's Statcast system reveal that a sudden increase in whiff rates on breaking balls can compress run-total lines within two batters, while defensive positioning heat maps adjust fielding-independent pitching values on the fly. People who follow these patterns observe that stolen-base success probabilities, derived from catcher pop times and runner acceleration, often prompt the quickest market movements in live betting interfaces during August contests when player fatigue begins to register in the data streams.
Hockey Performance Metrics
Hockey analytics incorporate shot quality models, zone-entry success rates, and goaltender save percentages calculated at the individual shift level, and these inputs produce swift changes to goal totals and player point props. Studies conducted by Canadian research groups have shown that high-danger chance creation rates above league averages frequently precede goal surges within the next two minutes of play, prompting in-play market recalibrations that reflect the elevated likelihood before the scoreboard updates. Observers note that micro-event data on face-off win percentages in defensive zones also influences period-specific wagers, since sustained territorial advantages compound over short sequences and alter expected goal differentials accordingly.
Shared Analytical Mechanisms
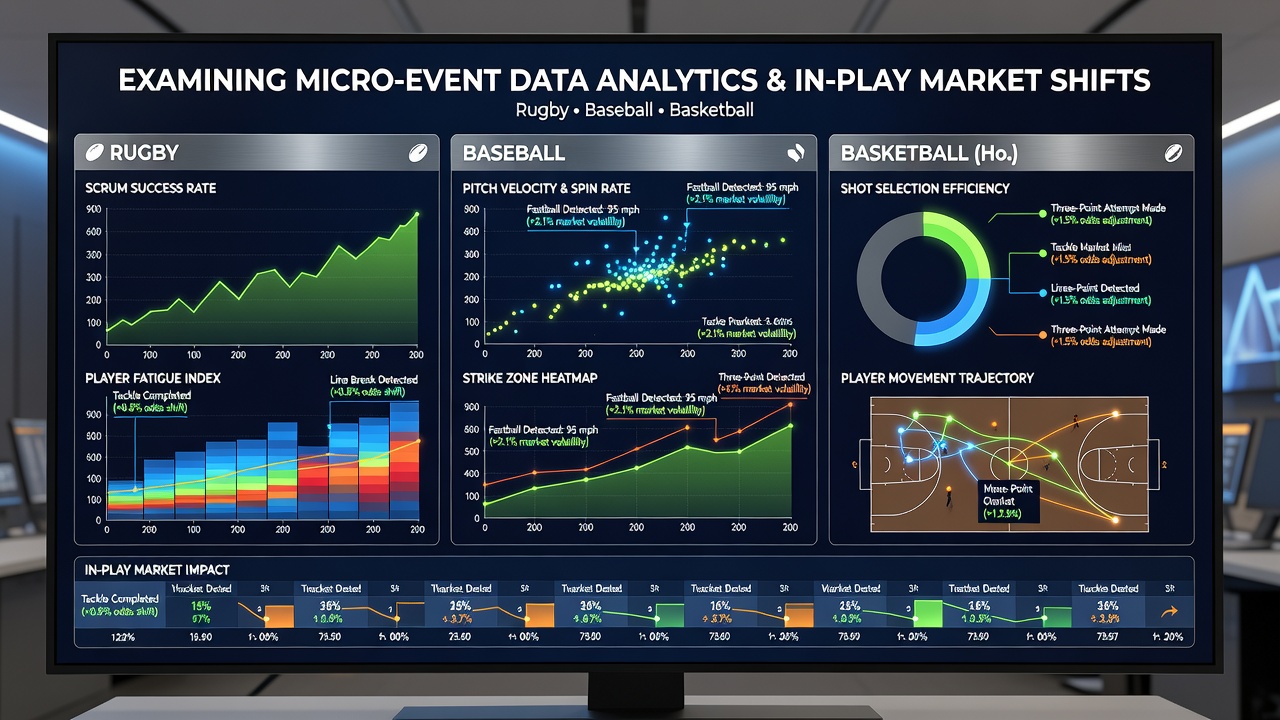
Across all three sports the integration of machine-learning models processes micro-event feeds to generate probability distributions that update continuously, and these distributions inform the pricing engines used by betting platforms. A report published by the Australian Institute of Sport outlines how synchronized data from multiple sources reduces latency between event occurrence and market reflection to under four seconds in controlled tests, allowing participants to react to emerging patterns such as fatigue indicators or tactical adjustments. What's interesting is that the same underlying sensor arrays and computer-vision pipelines support rugby tackle analytics, baseball pitch classification, and hockey puck-tracking systems, creating cross-sport efficiencies in data infrastructure.
Market Shift Patterns Through 2026
Industry reports project that by August 2026 the volume of micro-event data points per match will increase by approximately 40 percent in professional rugby, baseball, and hockey leagues, driven by expanded adoption of edge-computing devices on players and equipment. According to research from the International Olympic Committee, these expansions enable finer segmentation of in-play markets, including micro-propositions on single-shift or single-pitch outcomes that were previously unavailable. Those who examine historical datasets note that periods of elevated data granularity coincide with narrower spreads between opening and closing odds, because information asymmetry diminishes when all participants access similar real-time feeds.
Conclusion
Micro-event data analytics continue to reshape in-play market behavior in rugby, baseball, and hockey by translating detailed performance signals into rapid probability revisions, and the trajectory through 2026 points toward even more granular offerings supported by improved sensor networks and processing speeds. The patterns observed in each sport demonstrate consistent mechanisms that connect raw data streams to market outcomes without relying on subjective interpretation.